Gap and Flush Analysis: Complete Guide for Automotive Engineers
Introduction: The Critical Challenge of Automotive Interior Fit and Finish
In the competitive automotive industry, gap and flush tolerances are the primary indicators of vehicle quality that customers immediately notice. When a potential buyer sits in a vehicle, inconsistent gaps between dashboard components or misaligned trim panels suggest poor craftsmanship—even if the vehicle is mechanically sound.
For automotive engineers and OEMs, achieving consistent gap and flush across thousands of vehicles presents one of the most complex challenges in interior design. This challenge has intensified with the rise of electric vehicles, where minimalist interiors and premium materials make any dimensional variations immediately apparent.
The stakes are high: studies show that perceived quality directly impacts purchase decisions and brand loyalty. A 0.5mm gap variation can mean the difference between a premium feel and a disappointing customer experience.
What Are Gap and Flush in Automotive Engineering?
Gap Definition
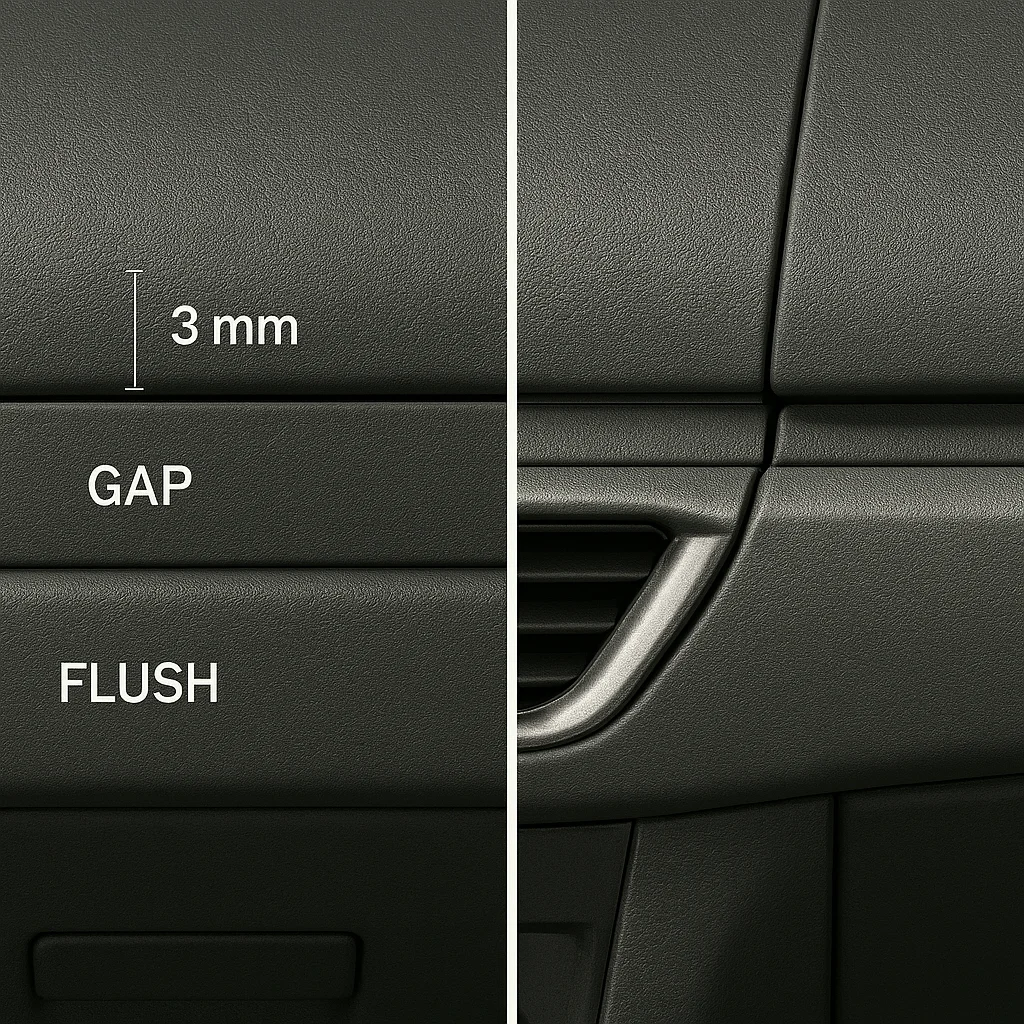
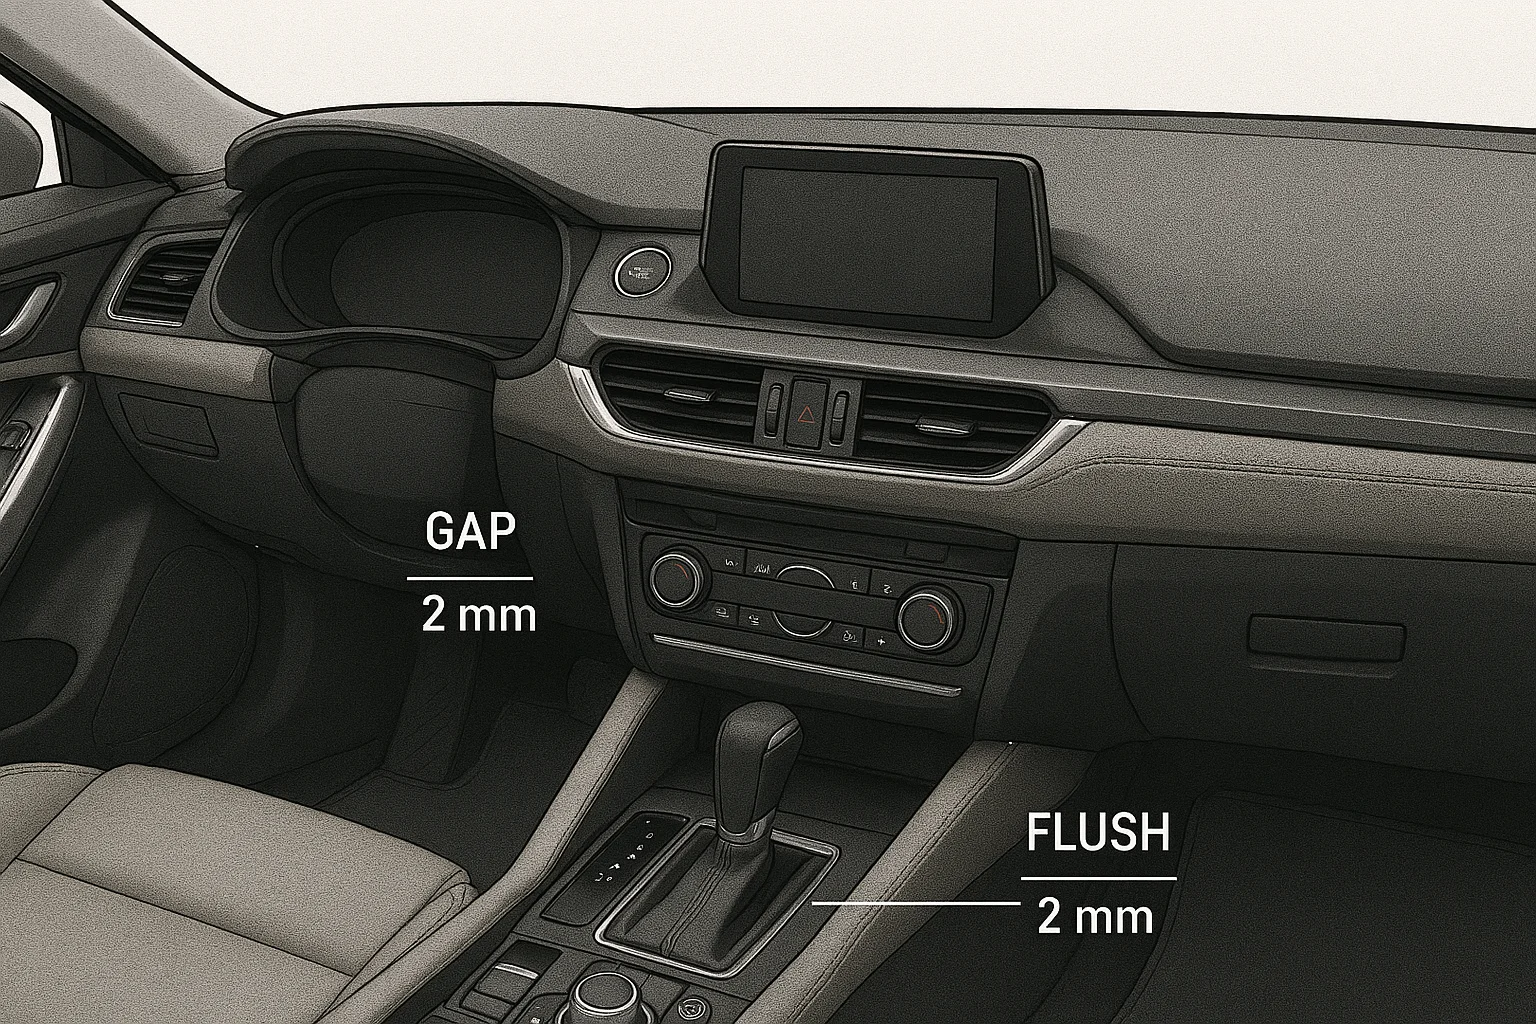
*Gap** refers to the space between two adjacent components in an automotive interior. In engineering terms, it's the measured distance between mating surfaces when components are assembled in their nominal positions.
Flush Definition
*Flush (also called step or offset**) refers to the difference in surface level between two adjacent components. Positive flush occurs when surface A protrudes above surface B, while negative flush indicates surface A is recessed below surface B.
Nominal Targets in Automotive Interiors
Typical gap and flush targets vary by application:
Dashboard components: 0.5mm to 1.5mm gap, ±0.3mm flush
Door trim to instrument panel: 1.0mm to 2.5mm gap, ±0.5mm flush
Console interfaces: 0.8mm to 2.0mm gap, ±0.4mm flush
A-pillar trim: 1.5mm to 3.0mm gap, ±0.6mm flush
Why Gap and Flush Matter in Modern Automotive Engineering
1. Perceived Quality (PQ) Impact
Perceived Quality is the customer's psychological assessment of vehicle value based on visual and tactile cues. In automotive interiors, gap and flush consistency accounts for approximately 40% of initial PQ impressions.
2. Brand Differentiation
Premium brands (Mercedes, BMW, Audi) maintain gap tolerances of ±0.3mm or tighter, while mass-market vehicles typically target ±0.6mm. This precision becomes a key differentiator in luxury segments.
3. Manufacturing Cost Implications
Tighter gap requirements directly impact manufacturing costs:
±0.3mm tolerance: 15-20% cost increase vs. ±0.6mm
±0.2mm tolerance: 25-35% cost increase vs. ±0.6mm
±0.1mm tolerance: 50-70% cost increase vs. ±0.6mm
4. Electric Vehicle Challenges
EV interiors present unique gap and flush challenges:
Large continuous surfaces emphasize any variations
Minimalist designs remove visual distractions
Premium materials (glass, metal, high-gloss plastics) show reflections that highlight gaps
Integrated displays create complex multi-material interfaces
Common Problems in Automotive Interior Assemblies
1. Complex Multi-Part Interfaces
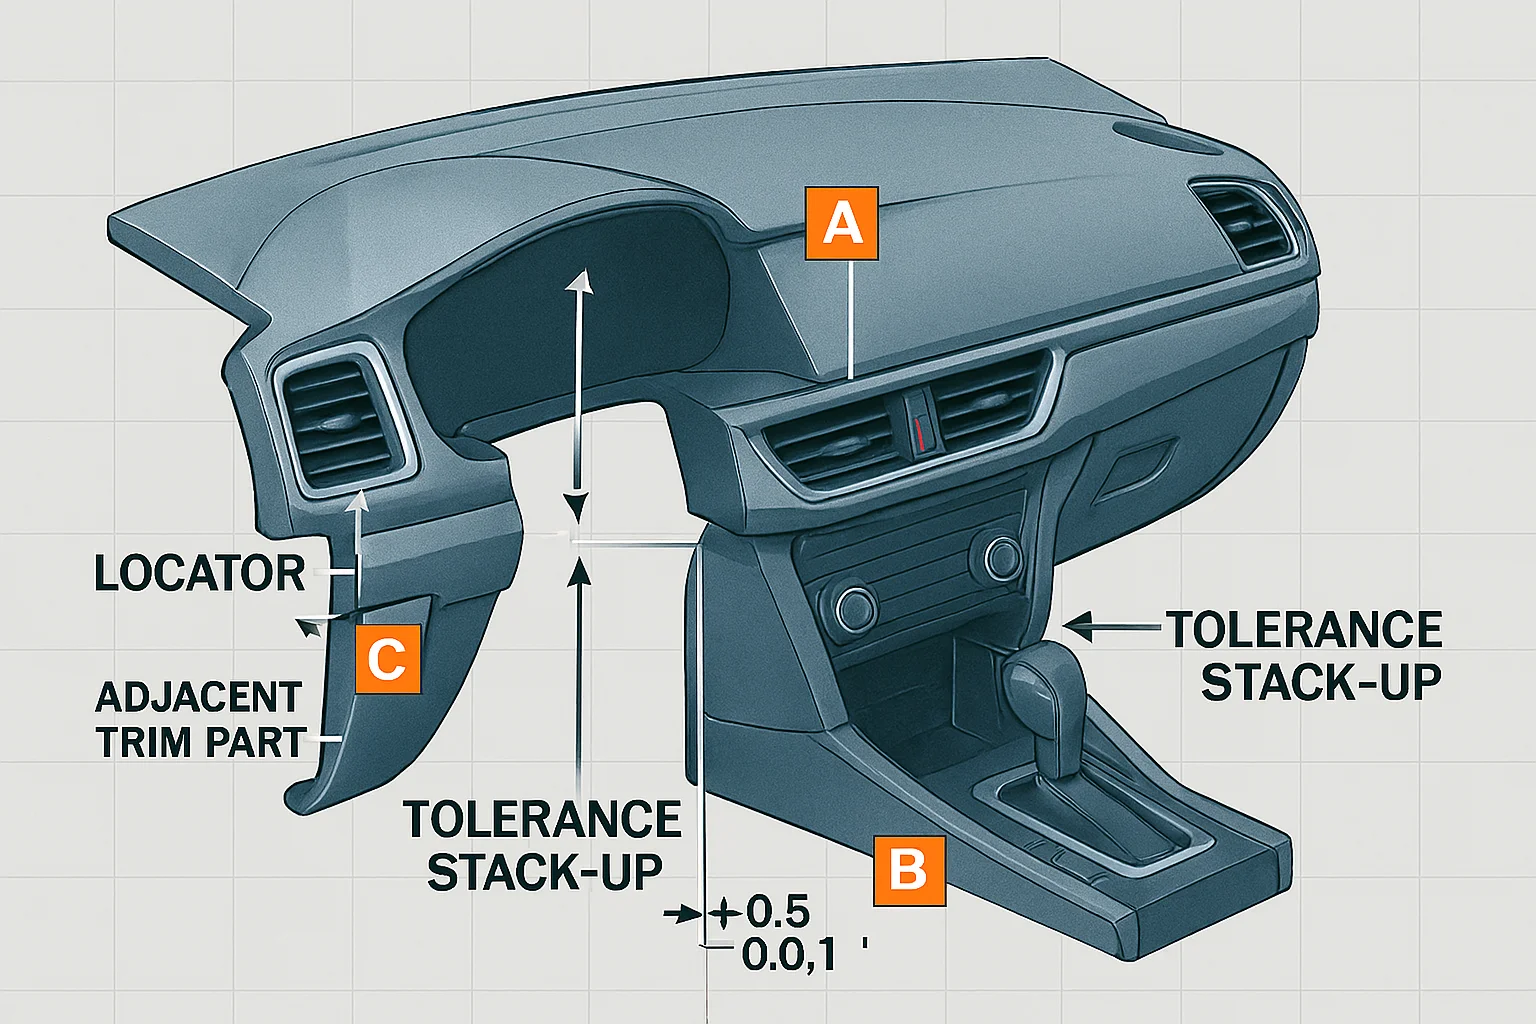
When a single instrument panel interfaces with door trim, center console, and A-pillar trim, tolerance accumulation becomes critical. Each interface adds potential variation, creating a tolerance stack-up challenge.
2. Material-Specific Behaviors
Different materials respond uniquely to temperature and assembly forces:
ABS plastics: Coefficient of thermal expansion (CTE) ~70-80 μm/m°C
Polycarbonate: CTE ~65-70 μm/m°C
Steel reinforcements: CTE ~12 μm/m°C
Aluminum components: CTE ~23 μm/m°C
3. Assembly Process Variations
Assembly methods introduce additional variation sources:
Fixture repeatability: ±0.1mm to ±0.3mm
Operator technique: ±0.2mm variation typical
Fastener torque: ±0.1mm influence on final position
4. Environmental Factors
Operating conditions affect final gap dimensions:
Temperature extremes: -40°C to +85°C automotive spec
Humidity effects: 0.1% to 0.3% dimensional change in plastics
UV exposure: Long-term material degradation affecting dimensions
Technical Analysis: Tolerance Stack-Up Engineering
1. Worst-Case vs. Statistical Analysis
*Worst-Case Analysis:**
Sum of all individual tolerances in the chain
Formula: T_total = T_1 + T_2 + T_3 + ... + T_n
Advantage: Guarantees 100% assembly success
Disadvantage: Often results in overly tight (expensive) tolerances
*Statistical Analysis (RSS):**
Root Sum Square method assumes normal distribution
Formula: T_total = √(T_1² + T_2² + T_3² + ... + T_n²)
Advantage: Allows looser individual tolerances
Disadvantage: 0.27% failure rate at 3σ
*Monte Carlo Simulation:**
Advanced statistical method using random sampling
10,000+ simulated assemblies
Accounts for non-normal distributions
Provides probability of success at specific tolerance levels
2. GD&T Application for Gap Control
*Position Tolerancing:**
Uses datum references to control feature location
Typical tolerance zones: 0.2mm to 1.0mm diameter
Applied to mounting holes, alignment features
*Profile Tolerancing:**
Controls surface form relative to datums
Critical for visible surfaces
Typical values: 0.1mm to 0.5mm total profile
*Datum Strategy:**
Primary datum: Establishes 3-2-1 constraint system
Secondary datum: Controls rotation about primary axis
Tertiary datum: Controls translation along primary axis
3. 3D Tolerance Analysis Tools
*Leading Software Solutions:**
CETOL 6σ: Advanced GD&T analysis with CAD integration
3DCS Variation Analyst: Industry standard for automotive applications
VisVSA: Siemens PLM ecosystem integration
*Analysis Process:**
Create assembly model with mating constraints
Apply GD&T callouts and tolerance values
Define measurement points for gap/flush evaluation
Run Monte Carlo simulation (10,000 iterations minimum)
Analyze sensitivity results to identify critical tolerances
Practical Solutions and Design Guidelines
1. Design for Assembly (DFA) Strategies
*Self-Aligning Features:**
Tapered locators guide components into position
Over-center mechanisms provide final positioning
Compliance features absorb minor variations
*Robust Mounting Systems:**
Three-point mounting: Establishes stable reference
Kinematic constraints: Prevents over-constraint
Compliant brackets: Allow thermal expansion compensation
2. Tolerance Allocation Best Practices
*Critical-to-Quality (CTQ) Identification:**
Customer-visible interfaces: Tightest tolerances (±0.3mm)
Hidden interfaces: Looser tolerances (±0.6mm to ±1.0mm)
Structural interfaces: Function-driven tolerances
*Tolerance Budgeting:**
Allocate 40% of total budget to critical interfaces
Reserve 20% for assembly process variation
Maintain 40% for manufacturing capability
3. Material Selection Guidelines
*Thermal Expansion Matching:**
Select materials with similar CTE values
Use compliant interfaces where CTE mismatch exists
Consider operating temperature range in design
*Dimensional Stability:**
Glass-filled polymers: Lower CTE, higher stability
Metal reinforcements: Reduce overall CTE
Hybrid structures: Optimize cost vs. performance
Real-World Case Study: Premium EV Dashboard Assembly
Challenge
A luxury EV manufacturer needed to achieve ±0.3mm gap consistency across a 1.2-meter wide dashboard assembly integrating:
Large glass display panel
Multiple plastic trim components
Metal structural reinforcements
Hidden air vent system
Engineering Solution
*Phase 1: Tolerance Analysis**
Created 3D CAD assembly with 47 components
Applied GD&T with datum hierarchy
Performed Monte Carlo simulation (50,000 iterations)
Identified 8 critical tolerances affecting final gap
*Phase 2: Design Optimization**
Redesigned mounting points for improved repeatability
Implemented three-point kinematic mounting strategy
Added compliance features for thermal compensation
Optimized material selection for CTE matching
*Phase 3: Manufacturing Integration**
Developed precision assembly fixtures (±0.05mm repeatability)
Implemented in-process measurement system
Created statistical process control (SPC) monitoring
Established operator training protocols
Results
Gap consistency: ±0.25mm achieved (target ±0.3mm)
Flush consistency: ±0.15mm achieved (target ±0.2mm)
First-pass yield: 98.5% (target 95%)
Cost impact: 12% increase vs. standard interior
Customer satisfaction: 23% improvement in PQ scores
Best Practices and Implementation Checklist
Design Phase Checklist
[ ] Establish datum hierarchy for all components
[ ] Perform 3D tolerance stack-up analysis
[ ] Identify CTQ interfaces and allocate tolerance budget
[ ] Design self-aligning features where possible
[ ] Consider thermal expansion in material selection
[ ] Implement compliance for CTE mismatch
[ ] Design for assembly sequence optimization
Manufacturing Phase Checklist
[ ] Develop precision assembly fixtures
[ ] Establish measurement system (CMM or optical)
[ ] Implement SPC for critical dimensions
[ ] Create operator training and certification
[ ] Establish quality control sampling plan
[ ] Develop problem-solving methodology
Quality Assurance Checklist
[ ] Define measurement methodology and equipment
[ ] Establish acceptance criteria for each interface
[ ] Create gauge R&R studies for measurement systems
[ ] Implement statistical monitoring of key dimensions
[ ] Develop containment procedures for non-conforming parts
[ ] Establish continuous improvement process
Advanced Topics and Future Trends
1. Smart Gap Monitoring Systems
*In-Process Measurement:**
Optical sensors measure gap during assembly
Real-time feedback to assembly equipment
Automatic adjustment for process variations
*Digital Twin Integration:**
Virtual assembly simulation
Predictive quality analytics
Real-time process optimization
2. Adaptive Tolerance Systems
*Active Gap Control:**
Shape memory alloy components
Thermal expansion compensation systems
Micro-positioning actuators
*Self-Adjusting Assemblies:**
Compliant mechanisms with automatic centering
Spring-loaded interfaces with preload control
Magnetic alignment systems
3. Industry 4.0 Integration
*IoT-Enabled Quality Control:**
Connected measurement devices
Cloud-based data analytics
Predictive maintenance for assembly equipment
*AI-Driven Process Optimization:**
Machine learning for pattern recognition
Automated root cause analysis
Continuous improvement algorithms
Conclusion: Engineering Excellence in Gap and Flush Control
Achieving consistent gap and flush in automotive interiors requires a systematic approach combining advanced tolerance analysis, thoughtful design, and precision manufacturing. The complexity increases with modern EV designs, where premium materials and minimalist aesthetics make any dimensional variation immediately apparent.
Success depends on:
Understanding the tolerance stack-up across multi-part assemblies
Applying proper GD&T principles with robust datum strategies
Designing for assembly with self-aligning features
Implementing statistical process control for manufacturing consistency
Using advanced analysis tools for prediction and optimization
For automotive engineers and OEMs, investing in proper gap and flush engineering delivers significant returns through improved perceived quality, customer satisfaction, and brand differentiation.
How MG Techworks Can Help
At MG Techworks, we specialize in automotive interior engineering with expertise in:
3D Tolerance Stack-up Analysis using CETOL 6σ and 3DCS
GD&T Strategy Development for complex assemblies
Design for Manufacturability optimizing cost vs. quality
Statistical Process Control implementation
Precision Assembly Fixture Design
Our team of experienced automotive engineers has helped leading OEMs achieve world-class gap and flush consistency while optimizing manufacturing costs.
*Ready to enhance your automotive interior quality?**
Contact MG Techworks to discuss your gap and flush challenges and discover how our engineering expertise can help you achieve manufacturing excellence.
Explore our Tolerance Stack-up Analysis services or learn more about our Product Design capabilities for automotive interiors.*